The “Settings” section: различия между версиями
Alina (обсуждение | вклад) (Новая страница: «800px|безрамки|центр|GUI Terminal 18 This section is to access the followed settings menu: * System Status; * Main...») |
Alina (обсуждение | вклад) |
||
| (не показано 5 промежуточных версий этого же участника) | |||
| Строка 7: | Строка 7: | ||
== The “System status” menu == | == The “System status” menu == | ||
| + | [[Файл:GUI Terminal 19.jpg|800px|безрамки|центр|GUI Terminal 19]] | ||
| + | === System === | ||
| + | The page with information about the system: manufacturer, model, version, software version, serial number, system name, SKU Number, line, terminal operating time, telephony operating time, number of licenses. The terminal operating time and telephony operating time are dynamically updated on the page. | ||
| + | === Network === | ||
| + | The page with information about the network status: IP address, mask, gateway, MAC address, network status, data transfer speed, duplex mode. | ||
| + | === Camera === | ||
| + | The page with information about connected cameras. | ||
| + | === Microphone === | ||
| + | The page with information about connected microphones. | ||
| + | === SIP/H.323 === | ||
| + | The page with information about SIP and H.323 parameters: protocol enable, registration enable, registration address, registration name, registration status. | ||
| + | == Diagnostics == | ||
| + | === Ping === | ||
| + | The page for checking the integrity and quality of connections in TCP/IP-based networks. By default the destination address is the network gateway address (Gateway). | ||
| + | |||
| + | To initiate a request: | ||
| + | # move focus to the “Ping IP” field | ||
| + | # press the OK control button (19) – the result will be displayed in the terminal window. | ||
| + | |||
| + | To change the destination address: | ||
| + | # move focus to the field with the address (10.1.1.1 or other); | ||
| + | # press the OK control button (19) – the page with the input module [Appendix A] will open; | ||
| + | # enter the required destination address (example: 10.1.1.10); | ||
| + | # save the entered data: return to the parent page; the result will be displayed in the terminal window. | ||
| + | |||
| + | To view the diagnostic result: | ||
| + | # move focus to the field with the terminal window; | ||
| + | # press the OK control button (19) – the terminal window will change color; | ||
| + | # use the “Up” (4) and “Down” (7) control buttons to move the lines for viewing; | ||
| + | # exit the terminal window viewing mode using the OK (19) or “Back” (8) control buttons. | ||
| + | === Trace === | ||
| + | The page for defining data routes in TCP/IP networks. The steps are the same as those described on the Ping page. | ||
| + | [[Файл:GUI Terminal 20.jpg|800px|безрамки|центр|GUI Terminal 20]] | ||
Текущая версия на 15:27, 2 сентября 2024
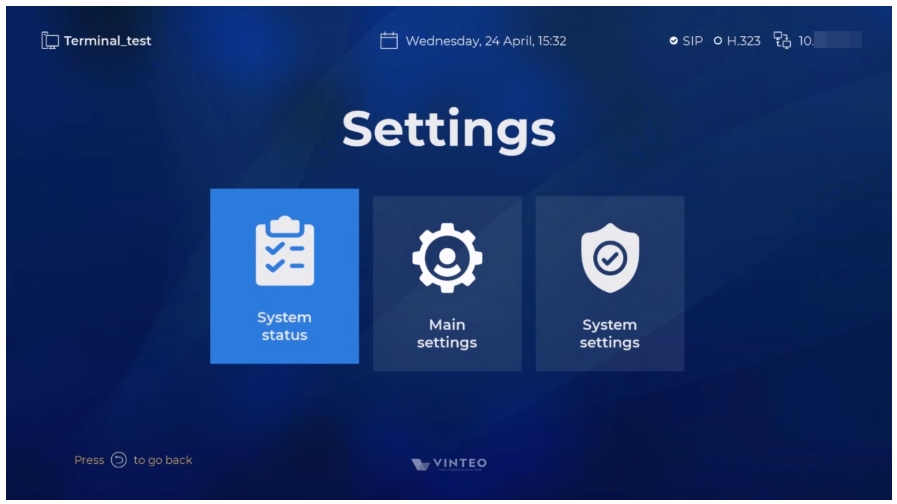
This section is to access the followed settings menu:
- System Status;
- Main Settings;
- System Settings.
Содержание
System
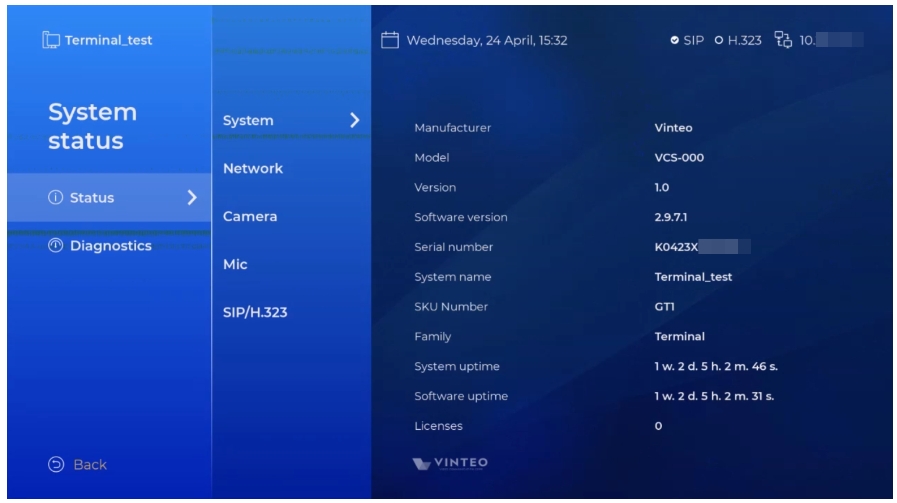
The page with information about the system: manufacturer, model, version, software version, serial number, system name, SKU Number, line, terminal operating time, telephony operating time, number of licenses. The terminal operating time and telephony operating time are dynamically updated on the page.
Network
The page with information about the network status: IP address, mask, gateway, MAC address, network status, data transfer speed, duplex mode.
Camera
The page with information about connected cameras.
Microphone
The page with information about connected microphones.
SIP/H.323
The page with information about SIP and H.323 parameters: protocol enable, registration enable, registration address, registration name, registration status.
Diagnostics
Ping
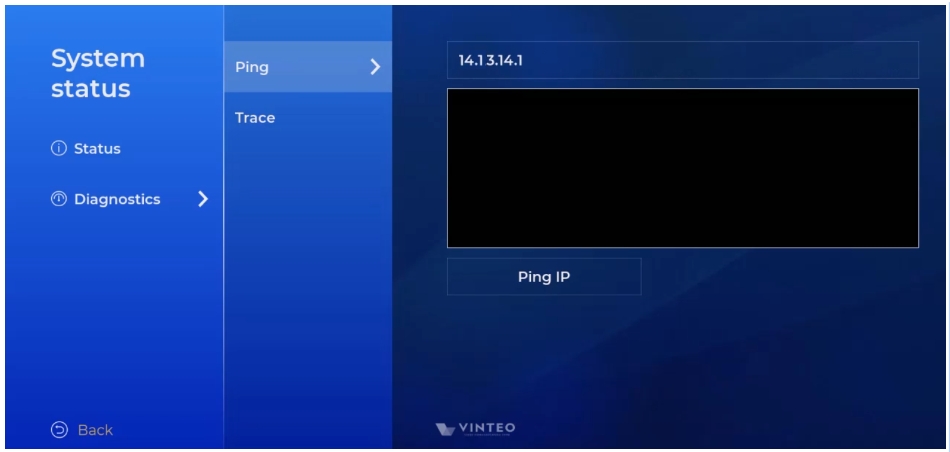
The page for checking the integrity and quality of connections in TCP/IP-based networks. By default the destination address is the network gateway address (Gateway).
To initiate a request:
- move focus to the “Ping IP” field
- press the OK control button (19) – the result will be displayed in the terminal window.
To change the destination address:
- move focus to the field with the address (10.1.1.1 or other);
- press the OK control button (19) – the page with the input module [Appendix A] will open;
- enter the required destination address (example: 10.1.1.10);
- save the entered data: return to the parent page; the result will be displayed in the terminal window.
To view the diagnostic result:
- move focus to the field with the terminal window;
- press the OK control button (19) – the terminal window will change color;
- use the “Up” (4) and “Down” (7) control buttons to move the lines for viewing;
- exit the terminal window viewing mode using the OK (19) or “Back” (8) control buttons.
Trace
The page for defining data routes in TCP/IP networks. The steps are the same as those described on the Ping page.


